
If your organisation wants to save energy, it is important that your staff become aware of the energy consumption they are responsible for. Simple changes in behaviour can often lead to significant energy savings, but those changes will only happen if people are aware of the energy consumption they have the power to control. The Carbon Trust estimates that savings of between 5 to 10% can be achieved through a successful energy awareness programme.
Everyone knows that saving energy is a good thing, but most people will only be motivated to change their behaviour if they understand how much energy they are wasting, and just how much potential there is for them to help save energy.
The traditional vehicle to get the energy saving message across is a poster campaign targeted at building users, typically featuring pictures of light switches, air conditioning units or polar bears on melting ice caps. The problem here is that most people have seen this type of campaign before; posters date very quickly and after an initial period are often ignored.
There are actually much better ways to encourage the occupants of your buildings to actively reduce their energy consumption. New energy dashboard and digital signage solutions allow organisations to deliver energy-awareness information in a more interactive way.
What is an Energy Dashboard?
Energy Dashboards like the ones provided by TEAM (EAA Ltd) are a way of displaying energy consumption information and energy saving messages via an organisation’s intranet, corporate website or by using digital signage displays in reception or other high traffic areas in buildings. Dashboards can retrieve data from your energy management database and individual sections of the screen can be used to display daily or annual consumption information and energy cost in a graphical format.
Why use Energy Dashboards?
Energy Dashboards enable organisations to demonstrate their commitment to sustainability by including dynamic graphics and key messages, ensuring the most up-to-date information is displayed. They provide an excellent way for Energy and Sustainability Managers to share their success stories of recent projects and plans for new initiatives, raising awareness amongst building users. These can often be designed to specifically suit your organisation’s own style, values and objectives.
Where energy dashboards are delivered via a web browser, they can also be interactive, so users have the opportunity to explore your organisation’s consumption information, drill down into the data, compare different buildings and even view a single meter’s energy demand. Additional content can easily be added and updated to make dashboards more relevant for users.
When dashboards are presented on digital signage displays, they can show single or multiple pages to allow you to combine energy performance data for the building in which the dashboard is located with totals for your organisation. Features such as live news feeds, live TV, corporate videos, weather and traffic forecasts can serve to attract people’s attention to the displays, ensuring that staff and visitors are kept fully informed of your organisation’s building performance. Additional pages can also provide rolling content with energy tips, energy savings achieved, video footage, advertisements or information about your new products or services. An additional advantage of using digital signage displays is that there is no need to interface with existing IT systems. Digital signage displays can be provided as standalone systems, connecting to an energy management database via 3G mobile networks. They can be updated easily and multiple screens can often be managed centrally without the need to visit the site where the display is located.
Regardless of whether dashboards are displayed via a web browser, or on digital signage displays or through both media, they also provide an excellent vehicle for general corporate messages and can help raise motivation overall. They open up access to energy data which would otherwise be locked away in your M&T system and only visible to energy management staff.
Energy Web Dashboards at the University of Central Lancashire
As part of the iBuilding project, the University of Central Lancashire (UCLan) has installed Energy Web Dashboards with the aim of demonstrating their commitment to sustainability and creating awareness of energy consumption amongst building users.
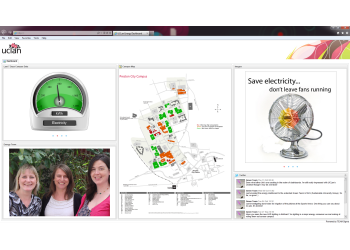
The energy dashboards display the energy consumption information of UCLan’s Preston Campus on their website based on the information contained in their TEAM Sigma energy management database. The dashboard graphically displays the last 7 days consumption, cost and emissions data for the whole of the campus, as well as an overview map with an option to drill down into the data for individual buildings. It also features details of UCLan’s Energy Team and their Twitter feed, enabling them to convey energy saving messages, report on the success of current projects and encourage interaction with building users.
Ruth Taylor, UCLan’s Energy and Carbon Management Officer comments: “The overall aim of the project is to change staff and student behaviour with regards to energy and water consumption. The new dashboard not only allows users to explore our energy and water consumption in depth so they can see the impact of their good work, but also provides two way communication between users and our Green Team.”
A Windows Desktop Gadget has been installed on all computers across the UCLan network which displays the last 7 days gas and electricity consumption in kWh for a single building (usually of that where the computer is based) in a dial format. The background colour of the dial indicates if energy consumption has risen above a certain level compared to the previous year to alert staff and students to increased consumption.
Ruth explains: “The gadget provides a quick overview of the campus energy and water consumption so students and staff can see if we are meeting our targets. This is the first time they have had this information at their fingertips and we are hoping it will see a positive change in behaviour.”
How to implement Energy Dashboards in your organisation
The first step in implementing a dashboard solution, is to make sure you have access to consumption data and if required implement a suitable metering solution. Required metering data could come from your existing M&T system, your energy bureau provider, your utility supplier or data collector. Great care should be taken with the design of the dashboard layout and the selection of features to ensure that it is in line with corporate guidelines and creates the best possible engagement with building users. For web dashboard applications, the IT department should be consulted to identify an appropriate hosting option, which could be done internally or through your dashboard provider.
It is essential that dashboards are continually updated to maintain interest and provide feedback so users can see the effect of their actions. To ensure the energy saving message is communicated throughout the organisation, energy champions for each building, department or site should be appointed and trained. They can become the eyes and ears of the energy management team and ensure that any ideas on saving energy are fed back to building users through the dashboards.
Dashboards that do not get updated frequently quickly become as useful as the old energy saving light bulb poster. It is vital to ensure information is always up-to-date and to use dashboard technology to provide targeted messages that are specific to your organisation. A message from your building energy champion can be shared to all users, giving feedback and encouraging energy saving, such as:
“Last month the sales department used half as much electricity per head as the admin and accounts offices when they introduced proper night-time switch-off of all equipment in the office. Well done.”
Today people are heavily influenced by digital media and web technology such as Twitter. By implementing Energy Dashboards it is possible to harness this influence by unlocking your energy management data and creating a sophisticated dashboard campaign directly accessible by your target audience. The opportunity to engage and inspire the building users into becoming an energy saving community is here and Energy Dashboards are the catalyst.
To join into a discussion about the subject please visit our relating blog post (https://blog.teamenergy.com/driving-engagament-with-an-energy-dashboard)
For more information please contact us:
TEAM (EAA Ltd)
Phone: +44 (0)1908 690018
Email: [email protected]
Web: www.teamenergy.com