
Over the past year there has been an astonishing number of new entrants to the energy and carbon software market placing energy web dashboards at the forefront of their marketing efforts. Many new dashboard applications are launched claiming to be much more effective in creating energy awareness and cutting energy costs than traditional poster campaigns showing polar bears on melting ice caps. However, in many cases, anticipated benefits are not being realised and once the wow factor of the graphical design has subsided, many web dashboards are not living up to expectations.
After all, they should work, shouldn’t they? Dashboards have been with us for decades providing the top level checks and balances that enable us to fly planes and drive cars without exceeding speed limits or running out of fuel. Whilst the obvious screaming protests of the engine should be enough to illicit an appropriate driver response, dashboards now flash lights and tell us when to change up or down a gear or to ensure our machines are run safely and efficiently. There are clear synergies that should be able to successfully migrate into the operation of energy efficient buildings, so why is it that many energy dashboard implementations are struggling to meet customer expectations?
The difficulty is that commercial, industrial and public sector buildings serve hundreds of purposes, rarely conform to similar design templates and are continuously changing the operational controls and processes they rely on to run modern equipment and comply with emerging legislation. A building may have hundreds or thousands of occupants, each with a unique set of energy related habits influenced by their views, lifestyle or their role within an organisation. The consequent datasets and user interfaces required to encourage appropriate energy efficient behaviours across an organisation are therefore vast and complex. So given the above, are there any buildings, in which dashboards can work and deliver the results expected by investors?
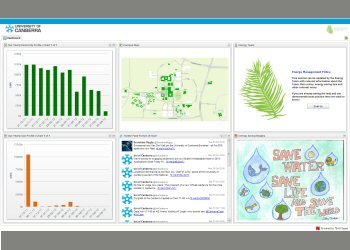
Dashboards in buildings can work and this is backed up by the achievements of some early adopters of the TEAM Energy Web Dashboards. It is important, however, that appropriate design consideration is given to system and audience objectives. We must not forget the very concept of a dashboard which is that all required information can be obtained from just one place. With more vendors looking to provide dashboard solutions, companies are vulnerable to operating a number of independent systems with duplicate or conflicting operating requirements that compete with each other for audience attention.
With this in mind, building owners and managers should consider the guidelines below to understand how energy dashboards can realise the opportunity to influence the behaviour of hundreds or even thousands of building occupants through one system.
Understand the Audience(s) and how you would like them to respond to the dashboard
The design and configuration of a dashboard needs to target the audience(s) who are best placed to reduce the highest amount of energy consumption or deliver specific corporate objectives. When placing a dashboard in a reception area, you need to define whether this is simply a PR message for your visitors or if you are asking them to adopt specific behaviours when inside your building. A dashboard for the board of directors which evidences year on year reductions in carbon intensity is of little use or interest to a maintenance engineer responsible for servicing portfolio HVAC and building boiler systems. Your audience(s) needs to be understood and their behaviour targeted by a dashboard flexible enough to engage with them on a personal level.
Access and Visibility
Dashboards need to be located in the working vicinity of the target audience to encourage its integration into daily operations. This may be on a large mounted display in a reception/office, on a small mounted display next to a control panel, on a public facing website accessible via the internet or corporate intranet or via a windows widget/gadget* installed on an individual’s pc desktop or mobile device. An appropriate dashboard solution may need to accommodate one or all of these capabilities to reach out and engage with all the intended audiences. Also be wary of systems that include a ‘number of users’ element to their licencing. A dashboard that is company-wide and accessible by everyone stands the best chance of maximising user engagement and success.
* A specific custom KPI graph or display that alerts the user to an issue that needs their attention from which an appropriate set of analysis tools or dashboard can be launched.
Keep the data flowing
Nothing is less engaging than a dashboard with no data or out of date information displayed. This immediately discredits the system and users are unlikely to visit the site again unless prompted. This is not limited to performance data. Energy saving tips or messages, energy efficiency projects and competitions and social media feeds all need to be reviewed and refreshed on a regular basis to maintain or improve user engagement. Like the energy efficiency poster that sits above the company photocopier, dashboards will soon go stale if they do not show anything new or innovative. A dashboard implementation is not a one-off project that can be completed in a year but an ongoing investment that needs to grow and evolve with your business. To this end, looking for a provider with a long term development path and a user base that will serve to enhance the product organically will certainly pay off.
Reward users with feedback and share success stories
When a pilot places an airliner on autopilot, he requires real time reassurance that the flight path is being adhered to. Similarly, building service engineers will want to know that buildings are currently operating within the designated control limits and see an immediate response from the system in response to any onsite activities. Daily or weekly displays may be sufficient for site energy managers and monthly data/trends used for regional or corporate wide comparisons and reporting. It all depends entirely on the roles of the audience and how they are expected to respond to the data being displayed. If a dashboard’s objective is to illicit a desired response from an audience, these responses need to be monitored and rewarded with updated information for the desired behaviour to become habitual. Furthermore, achievements and successes ought to be publicised to recognise the individuals involved. Socialising news and achievements through inbuilt social media streams that extend to exert influence beyond the local audience is one effective method worth consideration.
Dashboards should be dynamic
Finally, but arguably most importantly, energy dashboards need to be dynamic. They need to provide the required level of supporting data to answer the questions the numbers can generate and not information for information’s sake. In addition to simple facts and figures, users need to be able to see and interpret:
- Trends over time
- How portfolios are performing against target/budget
- Which buildings/processes are most impacting these figures
Many energy dashboard solutions work best when they are integrated with a company’s energy management system to allow those users responsible for energy management access to tools to:
- Identify waste
- Detect data quality issues
- Optimise controls
- Plan Maintenance Schedules
- Procure energy cheaper
- Comply with legislation
- Prioritise investments in a multi site environment
- Measure and verify energy efficiency project savings
This requires drill down capabilities from the dashboard that intuitively guide the user through the system at the touch of the screen or a click of the mouse. Users need to be able to investigate alerts, browse data and distribute or share information with other users. Thus whilst the dashboard serves to deliver headline messages and figures to its audience, its success will ultimately depend on the depth of analytical and reporting tools accessible from it and the extent to which it engages with and stimulates activity within its user community.
Let’s not forget that whilst ‘Energy Dashboard’ is a buzzword that ticks a PR box in Corporate Sustainability circles, they cost money to implement and energy to operate hence their presence will be short lived if they are not designed to deliver the benefits they promise.